Atmospheric

Article teaser image
The key air pollutants that combine to cause smog have dropped due to emissions regulations but baseline levels of ozone are continuing to creep up in the Lower Mainland of British Columbia. Scientists from the University of British Columbia, along with state and environmental groups, are trying to figure out why average levels of ground-level ozone haven't dropped with emissions over the last decade and have instead gone up. A new report from Metro Vancouver shows ambient levels of fine particulate matter, like sulphur dioxide, nitrogen dioxide and carbon monoxide, have declined by 20…
Article teaser image
The atmosphere contained little carbon dioxide (CO2) during the last Ice Age 20,000 years ago. Why did it rise when the Earth’s climate became warmer? Processes in the ocean are responsible for this, says a new study based on newly developed isotope measurements. Around 20,000 years ago, the atmospheric CO2 concentration was distinctly lower than in the following warm period, showed measurements from Antarctic ice cores. An international team of glaciologists looked even further back and found that the close connection between carbon dioxide and temperature has existed over the past 800,000…
Article teaser image
Climate change is a polarizing science policy debate the likes of which humankind has never witnessed before. Even President Obama's science advisor John Holdren never dreamed up this kind of doomsday scenario when he was writing books with the king of doomsday predictions, Paul Ehrlich. Women in the workforce, CFCs, acid rain, islands of garbage - nothing from past cultural debates compares to the scariness of rolling drought and melting glaciers.  What to do? On one side we have people who insist a world where elites have energy and others do not must be implemented right now. The…
Article teaser image
In areas where freshwater is scarce, recycling of wastewater seems to be common sense.  Perhaps not, argues Amy Townsend-Small, assistant professor of geology and geography at the University of Cincinnati, and a team of researchers from the University of California, Irvine. Their research shows that wastewater recycling processes may generate more greenhouse gases than traditional water-treatment processes. Townsend-Small, along with Diane E. Pataki, Linda Y. Tseng, Cheng-Yao Tsai and Diego Rosso, studied how different types of wastewater treatment affect emissions of one greenhouse…
Article teaser image
Forget mitigation and rationing, it is not the way cultures and progress work.  The long-term solution is obviously to engage in basic research and come up with effective clean energy but also to create fewer emissions while development is in progress. America never migrated to nuclear energy the way the French did so today up to 75 percent of electricity used in the United States is instead produced by coal-burning power plants and that means carbon dioxide (CO2) in the atmosphere and increased risk of global warming. To reduce the impact of current power generation, researchers are…
Article teaser image
Criegee biradicals, invisible chemical intermediates, are powerful oxidizers of pollutants such as nitrogen dioxide and sulfur dioxide produced by combustion and can naturally clean up the atmosphere. Sounds like fiction, right? These chemical intermediates were first postulated by Rudolf Criegee in the 1950s but researchers now say that they have been detected and with further research could play a major role in off-setting climate change.The detection of the Criegee biradical and measurement of how fast it reacts was made possible by an apparatus that uses light from a third-generation…
Article teaser image
Well, only if you intentionally ignore all of the data you have.Land based station average temps since 1980: YEAR MAXTEMP 1998 63.80498 1999 63.78164 2006 63.73651 2007 63.67106 2011 63.61039 2000 63.50858 2001 63.42102 2003 63.41823 2002 63.32876 2005 63.20733 2004 63.1366 2010 63.13626 2009 63.08481 2008 63.02112 1997 62.75371 1995 62.45432 1994 61.90294 1996 61.68232 9999 60.94027 1992 60.74694 1993 60.6451 1990 60.62875 1991 60.2001 1982 60.14809 1989 60.12214 1983 60.02621 1981 59.92682 1988 59.48542 1980 59.02204 1986 58.…
Article teaser image
In August of 2011, Hurricane Irene hit the Caribbean and and then traveled up parts of the eastern United States, bringing widespread wreckage in some places and, thanks to threatening midtown Manhattan, even more media coverage. The Category 3 storm whipped up water levels, generating storm surges that swept over seawalls and flooded seaside and inland communities. Some hurricane analysts suggested that Irene was a “100-year event”: a storm that only comes around once in a century.  But researchers from MIT and Princeton University created a numerical model and determined that if…
Article teaser image
You've heard or at least read about the pledge of the United States Postal Service: "Neither rain, nor snow, nor sleet, nor hail shall keep the postmen from their appointed rounds."  Well, that was before government workers had a union because today they quickly note that unshoveled snow, icy sidewalks, or snow plowed up against mailboxes are all exempt from that credo. But in February of 2010 they had a good excuse for suspending service.  The National Weather Service reported that three storms spanning from December to February in the winter of 2009-10 had dumped a whopping 54.9…
Article teaser image
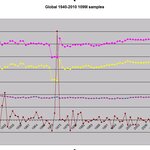
I found a problem where the original data from NCDC lost the tenth of a degree place during importing. So I corrected this problem and regenerated my graphs.Also based on emails with Dr Roy Spencer, he suggested that I remove stations that are not present through the majority of the time period analyzed. This was done for NH,SH and Tropics charts, where to be included the station had to have 240 days of data over at least 40 years from 1940-2010. These are the updated graphs.Global averages all stations:Map of global stations North Pole (>66.5 Lat)Map of NP Stations Northern Hemisphere (66…