How To Read A Graph - Part 2
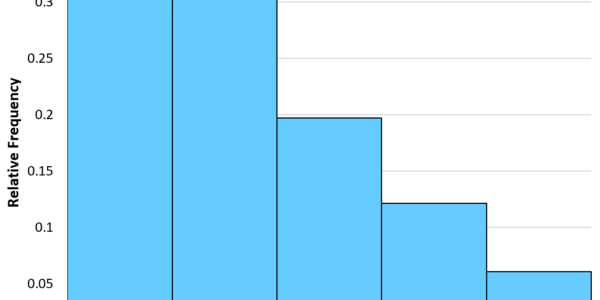
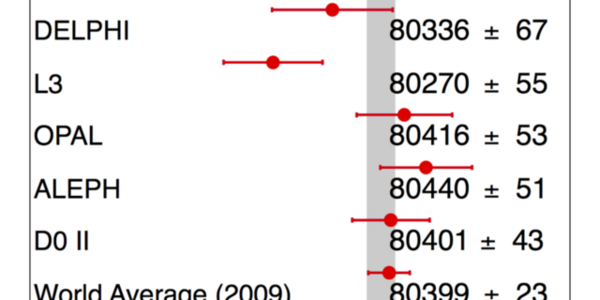
In a recent post I discussed how even the simplest kind of data display graph - the histogram - can sometimes confuse and be misinterpreted. Which is a total howler, as graphs are supposedly means of clarification and immediate, at-a-glance, interpretation of data summaries.In this second part of the article, I wish to consider a few other kinds of histograms, which instead of reporting relative frequencies are used to report the value of a quantity of interest (usually on the vertical axis, although exceptions abound) as a function of a variable which may be continuous, integer, or…